WordPress error logs record every PHP error, warning, and notice your site generates — and they’re the fastest way to find the real cause of almost any WordPress problem. WordPress doesn’t log errors by default; you enable logging by adding three lines to your wp-config.php file (or with a plugin), which creates a debug.log file inside wp-content. This guide shows how to enable, find, and actually read those logs.
When something breaks on your WordPress site — a critical error, a white screen, a plugin acting up — the error message on screen is usually vague. The error log is where the real answer lives: the exact file, line, and reason your site failed. Learning to enable and read it is the single most useful troubleshooting skill in WordPress. Let’s go through it step by step.
Table of Contents
What are WordPress error logs?
A WordPress error log is a plain-text record of the problems your site encounters, stored on your server and updated each time an error occurs. Each entry typically includes a timestamp, an error message, the file path where the problem happened, and the line number in the code. Together, these turn a vague “something went wrong” into a specific, fixable cause.
It’s worth being clear about an important distinction, because most guides blur it:
This article focuses on the WordPress debug log (debug.log) — the PHP-level log that captures errors from your themes, plugins, and core. For visitor-facing HTTP errors — 500, 502, 503, 504 — are recorded in your web server’s logs.
A blank white screen of death is a prime case where the debug log reveals the hidden fatal error. Output errors like cannot modify header information also appear here, naming the file and line where the stray output began.
How to enable WordPress error logs
WordPress logging is off by default, so the first step is turning it on. There are two ways: editing wp-config.php (works even when you’re locked out of the dashboard) or using a plugin (easier if you can still log in).
Method 1 — Edit wp-config.php (works even if locked out)
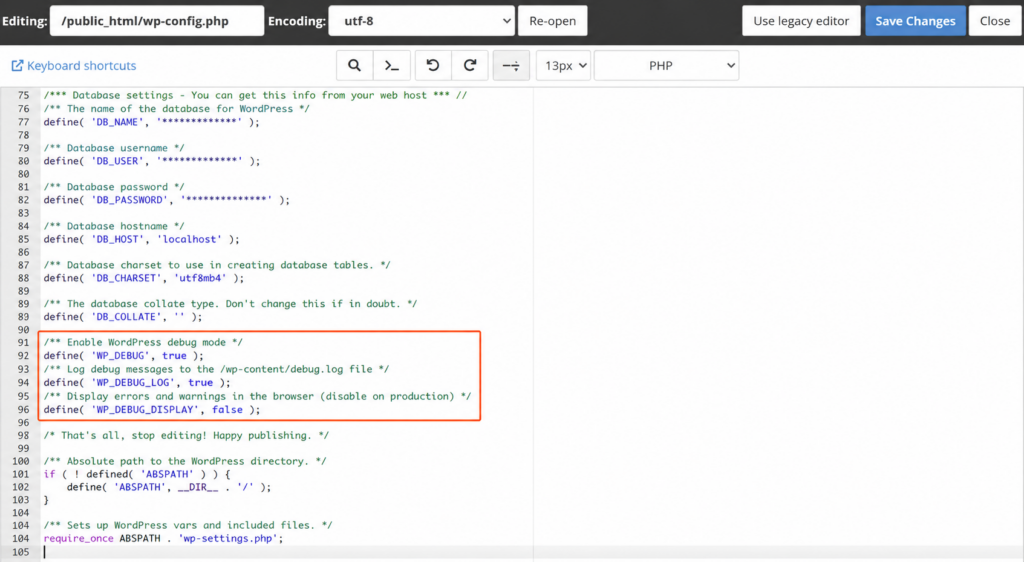
Connect to your site via FTP or your hosting file manager, and open wp-config.php in the root folder. Just above the line that says /* That's all, stop editing! */, add:
define( 'WP_DEBUG', true );
define( 'WP_DEBUG_LOG', true );
define( 'WP_DEBUG_DISPLAY', false );
Here’s what each line does: WP_DEBUG turns on debug mode; WP_DEBUG_LOG writes errors to a file instead of (or in addition to) showing them; and WP_DEBUG_DISPLAY set to false keeps those errors hidden from your visitors while still logging them. Save the file, and logging is active.
Want the log outside the public folder? By default, WP_DEBUG_LOG set to true writes to wp-content/debug.log — which can be publicly accessible. Instead of true, you can pass a custom file path, placing the log somewhere visitors can’t reach:
define( 'WP_DEBUG', true );
define( 'WP_DEBUG_LOG', '/home/user/logs/wp-errors.log' );
define( 'WP_DEBUG_DISPLAY', false );Just make sure the folder exists and is writable by the server. This is the safest way to keep logging enabled without exposing your errors publicly.
A note on related constants: WP_DEBUG on its own only enables debug mode — it’s WP_DEBUG_LOG that actually writes errors to a file, so you need both. For deeper debugging, two optional constants help: SCRIPT_DEBUG (set to true) makes WordPress load the non-minified versions of core CSS and JavaScript, and SAVEQUERIES (set to true) logs every database query for performance analysis. Use these only while actively debugging — especially SAVEQUERIES, which affects performance.
Method 2 — Use a plugin (easier, if you can log in)
If you can still access wp-admin and prefer not to edit core files, a debugging plugin does the same thing from the dashboard. Popular options include WP Debugging, Query Monitor, and WP Log Viewer. Install and activate one, and it enables debug logging for you — often with a built-in viewer so you can read the log without FTP. This is the safer route if you’re not comfortable editing wp-config.php, since a small mistake in that file can break your site.
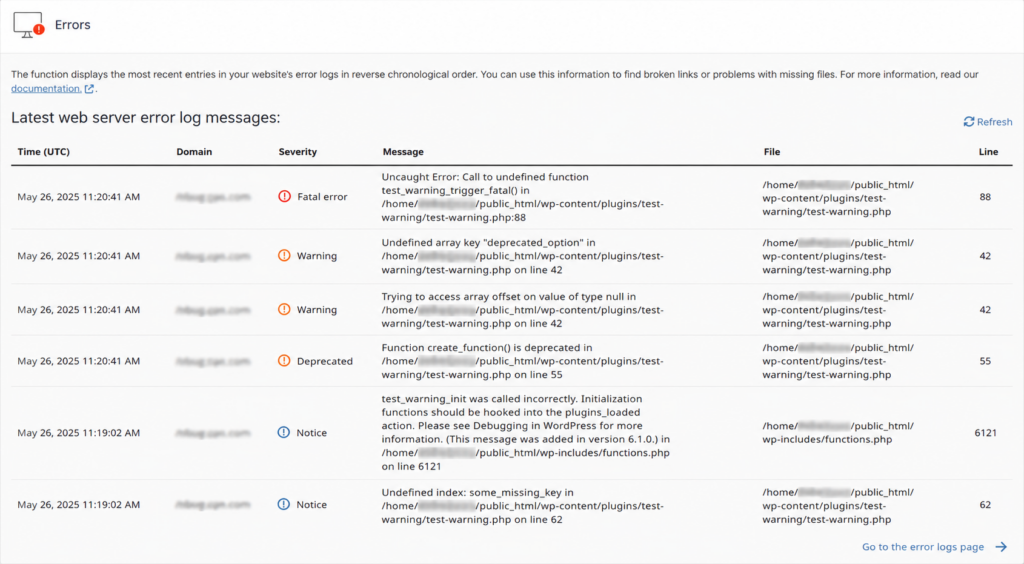
Method 3 — Check your hosting panel (no file editing). Many hosts expose error logs directly in their control panel, so you may not need to edit anything at all. In cPanel, look under the Metrics section for Errors — it shows recent PHP errors caught by the server. Managed WordPress hosts often have their own “Logs” area in the dashboard. If your host offers this, it’s the easiest route of all: no FTP, no code, just open the panel and read.
Where are WordPress error logs stored?
Once logging is enabled and an error occurs, WordPress creates the log file at:
wp-content/debug.logA few important notes about this file:
- It only appears after an error is logged. If you just enabled logging and don’t see debug.log yet, your site simply hasn’t logged anything. To test, revisit the page that was causing the problem so the error gets recorded.
- Timestamps are in UTC, not your local time — keep that in mind when matching an entry to when the problem happened.
- Some hosts store logs elsewhere. A few hosting providers use a dedicated
/logs/folder or a custom location accessible from your control panel. If debug.log isn’t in wp-content, check your host’s documentation.
How to find and view the log
To open the debug.log file:
- Connect to your site with an FTP client (like FileZilla) or your hosting file manager.
- Navigate to the /wp-content/ folder.
- Find debug.log, then right-click and choose Download, View, or Edit to read it.
If you used a plugin with a built-in viewer, you can skip FTP entirely and read the log right from your dashboard — which is also much faster for large logs (on busy sites, debug.log can grow to hundreds of megabytes).
Accessing logs via SSH and WP-CLI
If your hosting gives you SSH access, you can read the log straight from the command line — often the fastest way for developers. Once connected, view the latest entries with a standard command:
tail -f wp-content/debug.log-f flag streams new entries live as they’re written — useful while reproducing an error.If you use WP-CLI (the WordPress command-line tool, available on many hosts), some setups also expose a dedicated command such as wp php-errors to list recent PHP errors. SSH and WP-CLI are the quickest options on large sites, where downloading a huge debug.log over FTP would be slow.
How to read WordPress error logs
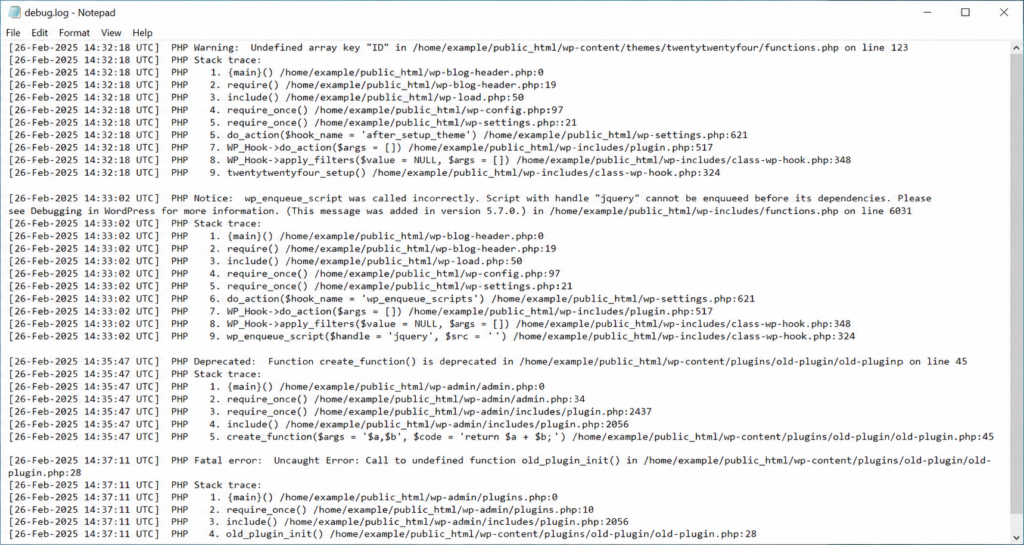
This is the part most guides skip — and the most useful. A log entry looks something like this:
[24-Jun-2026 14:32:07 UTC] PHP Fatal error:  Uncaught Error:
Call to undefined function my_plugin_init() in
/wp-content/plugins/example-plugin/example.php:42Reading it: the timestamp (UTC) tells you when; the error type tells you how serious it is; the message describes the problem; and the file path and line number point to the exact culprit — very often a specific plugin or theme file. When troubleshooting, look for the most recent entry that matches when your site broke.
The error type matters most. Here’s how to prioritize what you find:
In short: Fatal errors are what break your site and what you should fix first — they’re also what cause the critical error message. Warnings and notices are worth cleaning up but rarely take a site down.
Using logs to fix specific errors
The error log is your starting point for almost every WordPress problem. Once you find the offending file in the log, the fix usually follows:
- If the fatal error names a plugin file, deactivate or roll back that plugin.
- If it names a theme file (often
functions.php), switch to a default theme or undo the recent edit. - If you see a memory error, increase the PHP memory limit.
- For a generic crash, see our guide on the WordPress critical error, and for the server-side version, the 500 internal server error.
- If the log points to the database, see error establishing a database connection.
- PHP limit errors like the upload_max_filesize error also surface here when uploads fail.
Server logs vs. WordPress debug log
One key point that trips people up: not every error shows up in debug.log. The WordPress debug log captures PHP errors from your code. But visitor-facing HTTP errors — 500, 502, 503, 404 — are recorded in your web server’s error and access logs, which are separate.
You’ll usually find these server logs in your hosting control panel. In cPanel, for example, look under the Metrics section for Errors (and Raw Access for the access log). If your site is throwing a server error rather than a PHP error, that’s where to look. Good hosting makes both kinds of logs easy to reach — which matters more than people realize when a site is down and every minute counts.
Important: turn logging off and secure the file
Two things to do once you’re done debugging:
WP_DEBUG back to false and delete the log. Also note that wp-content/debug.log can be publicly accessible by default — it may expose file paths. While debugging, restrict access to it or use a custom log path outside the public folder.Watch the log size. On a busy site, debug.log can grow to hundreds of megabytes surprisingly fast, eating into your disk space and becoming slow to open. If you keep logging on for an extended period, check the file size periodically and clear it (delete the file — WordPress recreates it) once you’ve resolved an issue, so you’re always looking at fresh, relevant entries. Some debugging plugins and hosts can rotate or cap the log automatically.
Frequently asked questions
Copahost gives you easy access to error logs, a file manager, current PHP versions, and one-click backups — so when something breaks, you find and fix it fast.
See web hosting plansConclusion
WordPress error logs are the difference between guessing and knowing. Enable logging with three lines in wp-config.php (or a plugin), reproduce the error, then open wp-content/debug.log and read the most recent fatal error — it usually names the exact plugin, theme, or file at fault. For visitor-facing HTTP errors, check your server logs in the hosting panel instead. And remember to turn debug logging off and protect the file when you’re finished. Once you’re comfortable reading logs, almost every WordPress error becomes something you can diagnose in minutes instead of hours.
This error is one of several common WordPress and server errors — for the full picture, see our complete guide to common WordPress errors.
