JavaScript is one of the most complicated languages in the programming world. It is an asynchronous programming language that can make it very complex unless we have proper knowledge of it. How to debug Javascript in Chrome seems to be one of the most difficult steps of coding javascript. Sometimes, it is so hard, we can’t even find what the error is because the code is working fine. Yes, many times, we think there should be an error but actually, there is not. In this article, we will see an example of such code which is working but not according to our requirements, and then we will use devtools provided by google’s chrome browser to solve the issue.
Topics in this article
- Using chrome console for a quick debugging
- How to debug Javascript in Chrome using devtools (extended method)
- Conclusion
Using console for a quick debugging
When we write code in HTML and Javascript, we use a browser to see the results. In the google’s chrome browser, it’s devtools provide console which shows every error that exists in our javascript code. This makes it easy to debug the code. Let’s understand the use of console with an example.
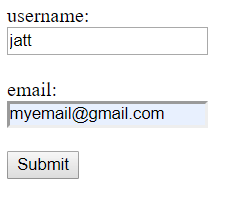
The following code has two input fields and a button. It is supposed to work in a way that when the button is clicked, the data from the input fields is displayed below the button.
<html>
    <body>
        username:<br>
        <input type="text" id="username"><br><br>
        email:<br>
        <input type="text" id="email"><br><br>
        <button onclick="login()">Submit</button><br>
        <p></p>
    </body>
    <script>
        function logien(){
            var username = document.getElementById('username').value
            var email = document.getElementById('email').value
            document.getElementById("result").innerHTML = "Username is " + username + " and email is " + email
        }

    </script>

</html>
The output is:
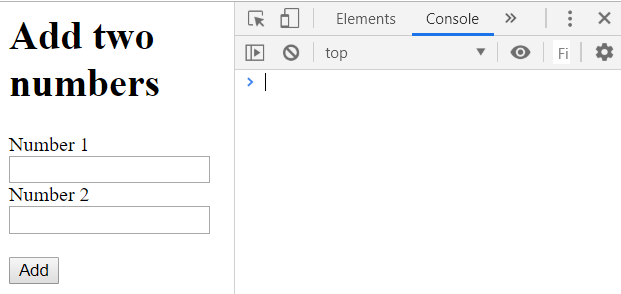
But when we click the button, nothing happens. The data is not displayed below the button. There is some error in the code. Let’s check the console by pressing control+shift+I for windows/linux or command+option+I for mac.
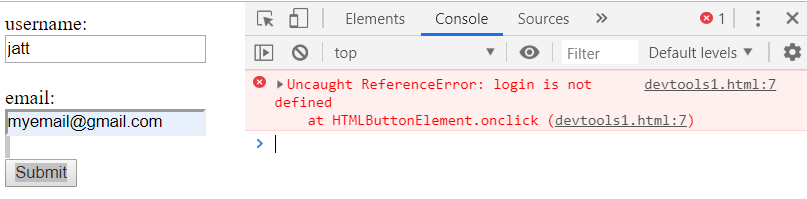
We can see an error message is displayed in the console. It says that login is not defined. We named the function in the onclick attribute of the button as login. So now we know where is the problem. The task how to debug Javascript in Chrome can be done by this quick method.
In the script tag, there is a spelling mistake when we defined the function.
function logien(){Let’s correct the mistake. Let’s reload the page. Then, fill the details again and click the button.
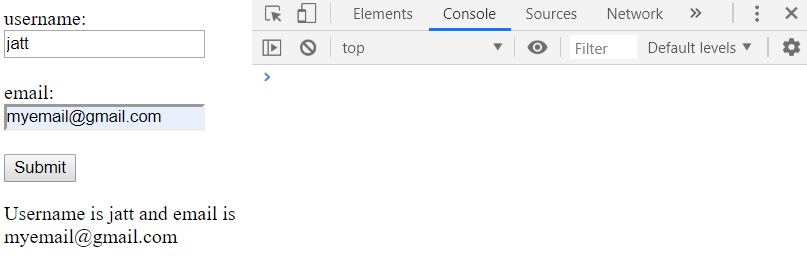
We can also see that there are no errors in the console.
How to debug Javascript in Chrome using devtools (extended method)
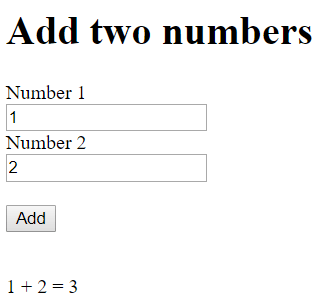
We will learn how to debug a simple code in javascript using chrome devtools. The example consists of a simple HTML code in which we input two numbers and click the button to get their sum.
1. Find the bug
To start the debugging process, first of all, we have to find the bug. We have to find what is the problem we are facing. Observe the following image.
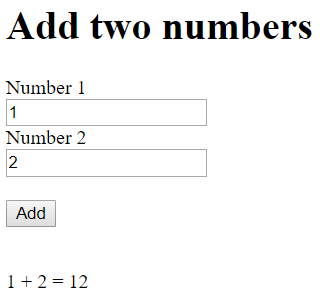
Clearly, the output is wrong. 1 added to 2 should be 3 but it shows 12. We have our bug now.
2. Getting familiar with the Sources panel UI
We can open the chrome devtools by pressing Control+Shift+I for windows/linux or Command+Option+I for mac. A new window will pop up from the right.
The devtools provide lots of options like changing CSS, monitoring networks, checking performance, etc. But what we need is sources UI panel. We can open them by click on the sources tab for that.
The sources UI has three parts.
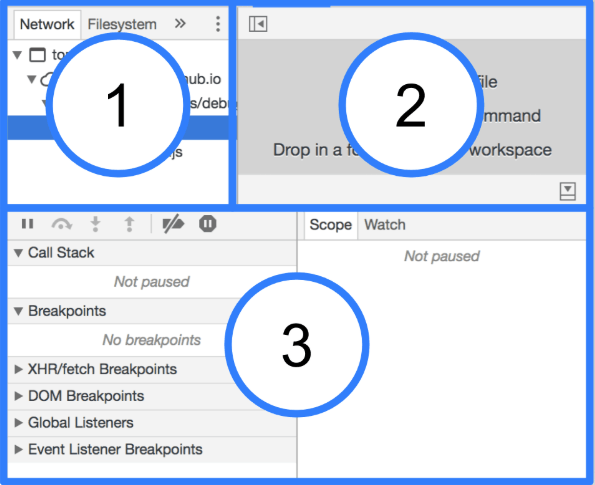
These three parts are:
- The File Navigator pane
- The Code Editor pane.
- The Javascript Debugging pane
The File Navigator contains all the files requested by the page. The selected file from the File Navigator appears on the Code Editor pane. The JavaScript Debugging pane provides various tools for debugging.
3. Using breakpoints
The classic approach of debugging is using console.log() where the bug seems to be. It can solve the problem but there is a faster approach. We can use breakpoints instead of console.log(). We can use breakpoints to pause the code and examine it in-between execution. This can solve many problems and it is very fast. While using console.log(), we have to open code manually and insert console.log() in it. But the breakpoints are provided by devtools and can be applied very easily.
Let’s stop and think for a moment about the program we used to add two numbers. We can make a guess that everything was correct until we pressed that click to add those two numbers. By using the breakpoints, we should pause the code before the click event and examine, if we can find any problem there. We can use EventListener breakpoints to do that.
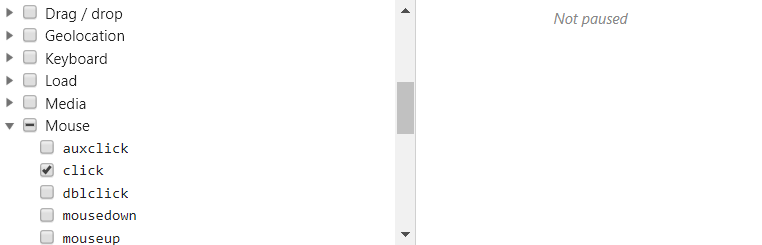
- In the Javascript debugging pane, expand the EventListener breakpoints section. We can find many expandable event categories there.
- Find the mouse category and expand it.
- Check the click option.
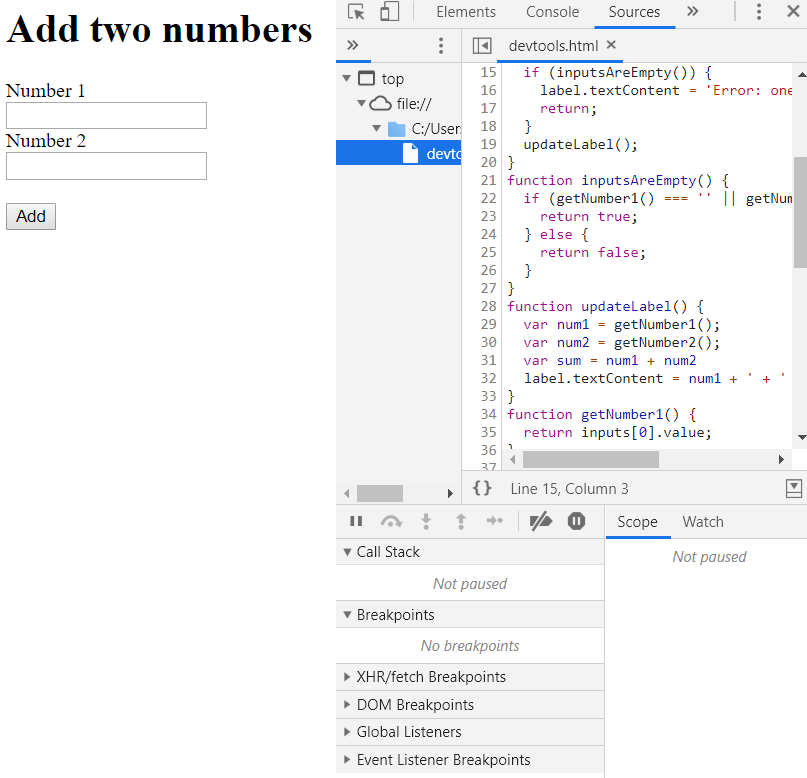
Now every click event will be paused. Once again, type 1 and 2 in input fields and press the button. The HTML code will get pause immediately after the button is clicked. Observe line number 15 which is highlighted because the code is paused at that very line.
4. Stepping through the code
In the last step, we paused our code immediately after the button was clicked. The code was paused at the following line of code.
if (inputsAreEmpty()) {In the Javascript debugging pane, find the following the toolbar.
![]()
The second button from the left is used to step over to the function. After clicking it, we can see, the code stepped to the next function.
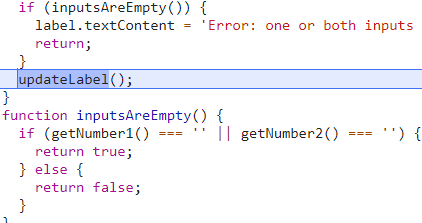
We used this option because we can guess that probably the problem is in the updateLabel() function because all the important operations are performed here.
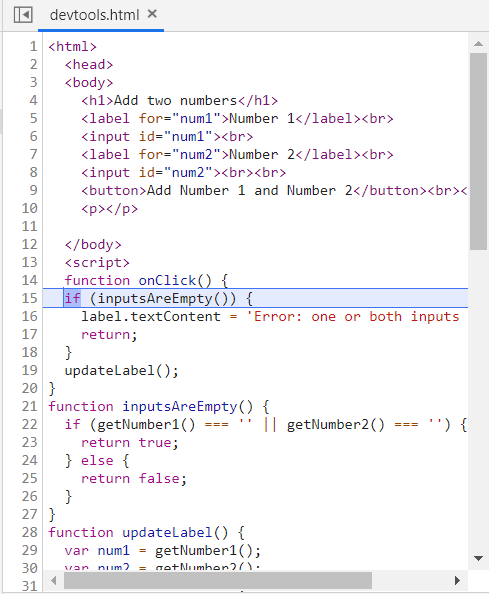
5. line-of-code breakpoint
The line-of-code breakpoint is the most commonly used breakpoint. We can use it wherever in a line we think, there is some problem. The updateLabel function is where we are fetching both values. Have a look at the last line of the updateLabel() function.
label.textContent = num1 + ' + ' + num2 + ' = ' + sum;
num1 and num2 are the values we typed in the input fields and sum is total of them. We can probably find our problem in this line. Now we have a specific line and thus, we can use a line-of-code breakpoint here.
To the left of this line, we can see a number, i.e. 32. We can set a line of code there to by clicking on it.
![]()
Now we can resume the execution by clicking the first option on the toolbar above Javascript debugging pane.
![]()
The execution will resume and it will stop at line number 32 because it is the line-of-code breakpoint. There we can see the values of num1, num2, and sum.
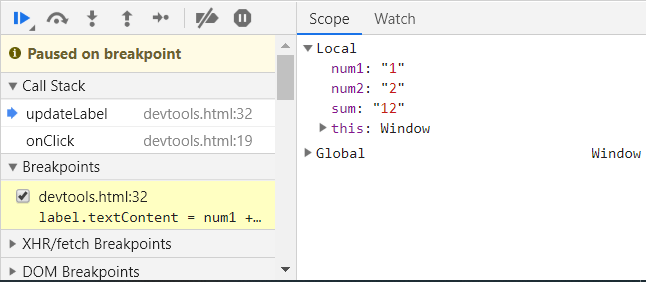
Look at these values carefully. Each of the values is wrapped in double-quotes. We never write integers between double-quotes. Only strings are in double-quotes. This is suspicious.
5. Checking the values
In the last step, we analyzed line number 32 using line-of-code breakpoint. We can gather more information by using other tools provided by devtools. The following method can help us reach a conclusion.
Watch expression
We can use the watch expression to monitor the values of variables over time. Open the watch tab. Click on the add expression(+ sign) and then type “typeof num1”.
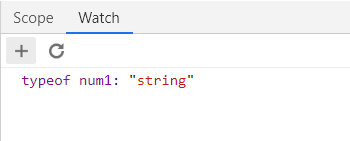
We can notice that the type of the first variable is a string. Let’s check for the other variables.
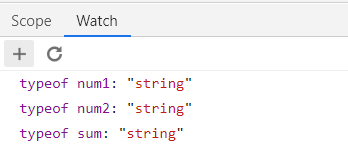
The types of num2 and sum is also a string. That is the reason why we get, 1 + 2 = 22. Adding anything to a string always result in a string in javascript
6. Fix the code
As we know, what is the problem, we can solve it now. We can convert the strings into integers by using the parseInt method.
var sum = parseInt(num1) + parseInt(num2)
Conclusion
Google chrome is the best browser in the world. It is not only the best for surfing, but for developers too. The devtools provided by chrome are very helpful in a number of ways. One of the best tools is the one we learned in this article. We can solve the issue of how to debug Javascript in Chrome either by this quick or the extended methods.
