
When a WordPress site breaks — a white screen, a critical error, a plugin misbehaving — the cause is usually a PHP error you can’t see. WordPress hides these by default. Debug mode turns them back on, showing (or logging) exactly what went wrong and where. This guide explains what WordPress debug mode is, how to enable WP_DEBUG safely, how to log errors to a file, how to read what you find, and the tools that make debugging faster. The golden rule up front: debug mode is for finding problems, not for leaving on — never run it on a live site longer than you need to.
Editing wp-config.php can break your site if done wrong, so back it up first. And because debug mode can display sensitive file paths and code to visitors, run it on a staging site when possible — or at least log errors to a file instead of showing them on screen (covered below).
Table of Contents
What is WordPress debug mode?
WordPress debug mode is a built-in troubleshooting feature that reveals the PHP errors, warnings, and notices happening behind the scenes. By default WordPress suppresses these — a fatal error just shows a white screen or a generic “critical error” message, telling you nothing useful. Debug mode changes that: it reports exactly what failed, in which file, and on which line.
It’s controlled by a PHP constant called WP_DEBUG in your wp-config.php file. Off by default (false), you set it to true to turn debugging on. Developers use it constantly during plugin and theme work; site owners reach for it when something breaks and they need to know why.
Under the hood, when WP_DEBUG is true, WordPress sets PHP’s error reporting to report everything, so problems that were silently ignored become visible.
The WordPress debug constants
Debug mode isn’t a single switch — it’s a small family of constants that work together. Understanding them is the key to debugging without exposing errors to your visitors.
A quick note on SCRIPT_DEBUG: WordPress normally loads minified versions of its core CSS and JavaScript for speed. Setting SCRIPT_DEBUG to true forces it to load the full “dev” versions instead — which matters when you’re debugging a styling or script problem in core, a theme, or a plugin, and need to read the un-minified code. Most site owners never need it, but it’s invaluable for front-end development.
How to enable WordPress debug mode
There are three ways to turn on debug mode. Pick based on how comfortable you are with code and whether you can reach the dashboard.
Method 1: Edit wp-config.php (the standard way)
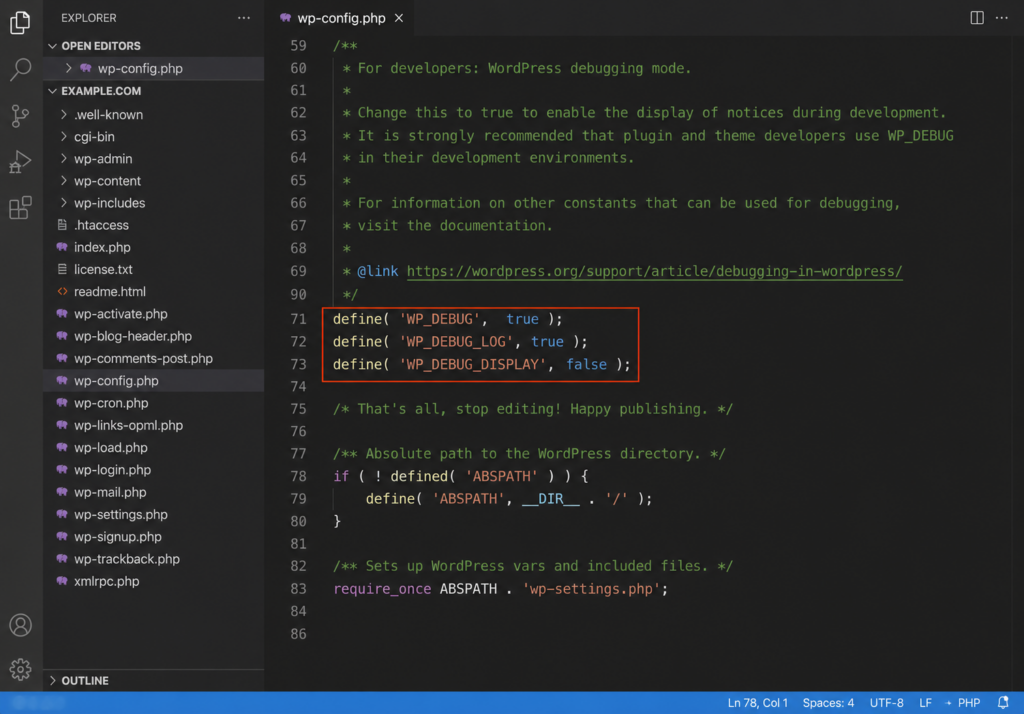
Connect to your site via FTP or your cPanel File Manager, and open wp-config.php in the root folder. Find the line define( 'WP_DEBUG', false ); and replace it with the block below. If the line isn’t there, add this above the line that says /* That's all, stop editing! Happy publishing. */:
// Enable debug mode
define( 'WP_DEBUG', true );// Log errors to wp-content/debug.log
define( 'WP_DEBUG_LOG', true );// Hide errors from visitors (recommended on live sites)
define( 'WP_DEBUG_DISPLAY', false );
@ini_set( 'display_errors', 0 );
This is the recommended configuration: it enables debugging, writes everything to a log file, and keeps errors off the front end so visitors never see them. For a full breakdown of the file itself, see our wp-config.php guide.
Method 2: Use a plugin (easiest, no code)
If you can reach your dashboard and prefer not to edit files, the free WP Debugging plugin (by Andy Fragen) turns debug mode on automatically when activated — it sets WP_DEBUG and WP_DEBUG_LOG to true out of the box, with a settings page under Tools → WP Debugging. When you’re done, just deactivate the plugin to turn debugging off. It’s the safest route for beginners.
Method 3: Your hosting panel
Some hosts include a debug toggle in their control panel, so you can enable it without touching files or plugins. Check your hosting dashboard’s WordPress tools. On Copahost, you can edit wp-config.php directly through cPanel’s File Manager using Method 1.
Where to find the debug.log file
Once WP_DEBUG_LOG is on, WordPress writes every error to:
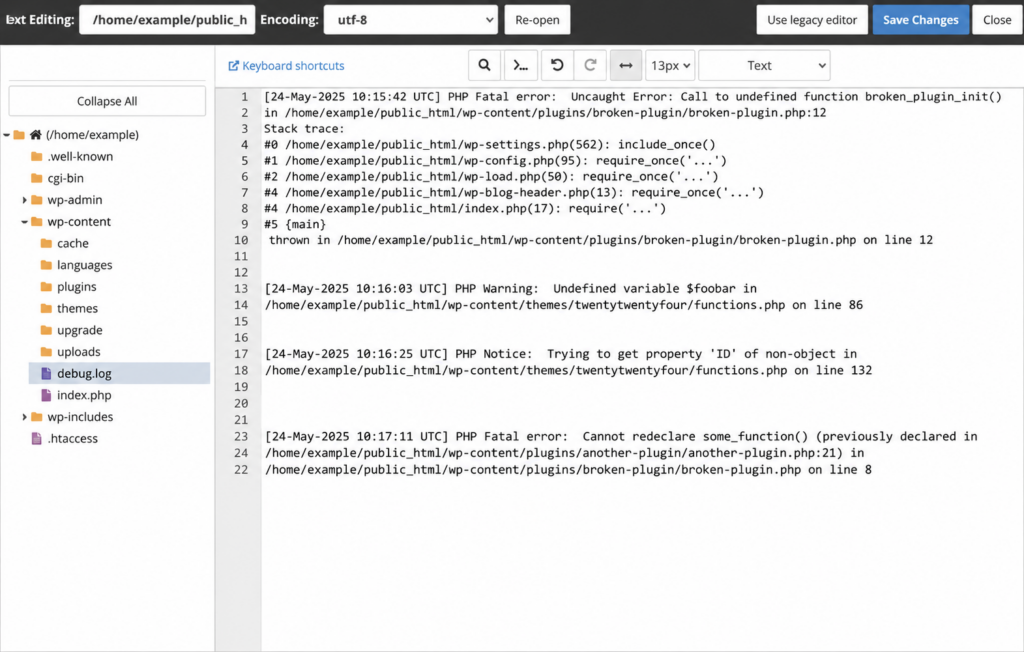
/wp-content/debug.logOpen it through your File Manager or FTP, or download it to read in a text editor. The log only records errors that happen after you enable it, so if you’re chasing a specific bug, reproduce the problem (visit the broken page, repeat the action) and then check the log. Each entry includes a timestamp, the error type, and — crucially — the file path and line number where it occurred, which usually points straight at the offending plugin or theme.
By default the log lives at /wp-content/debug.log, but you can send it somewhere else — useful if you want to keep it outside the web-accessible folder for security. Instead of setting WP_DEBUG_LOG to true, give it a full file path:
define( 'WP_DEBUG_LOG', '/home/user/logs/wp-errors.log' );WordPress will write the log to that path instead of the default location. Just make sure the folder exists and is writable by the web server.
How to read the debug log
The log can look intimidating, but the entries fall into a few types. Knowing which is which tells you how urgent each is:
- PHP Fatal error — the serious one. This is what causes white screens and critical errors; it stops the site. The message names the file and line, which usually identifies the exact plugin or theme at fault.
- PHP Warning — something unexpected happened but PHP kept running. Warnings don’t crash the site alone, but often flag a bug that could become fatal under other conditions.
- PHP Notice — a minor issue like an undefined variable. Usually harmless in production, but thousands of the same notice per load can signal a performance problem.
- WordPress database error — a line starting with “WordPress database error” means a query failed, typically from a plugin generating bad SQL.
In practice, scan for Fatal error first — that’s what’s breaking the site. The file path in that line is your prime suspect; deactivate that plugin or switch that theme to confirm.
The debug.log isn’t the only log worth checking. Your server keeps its own error logs too, and reading both gives a fuller picture of what’s failing. For a complete walkthrough of every log WordPress and your server produce — and how to read them — see our guide to WordPress error logs.
It’s also worth knowing that you don’t always need WP_DEBUG to see errors. Most hosts capture PHP errors in a server-level error_log file, accessible from your hosting panel — on Copahost, through cPanel’s metrics/logs section. If you can’t or don’t want to enable debug mode, that server log is often enough to identify a fatal error.
Debugging tools that make it easier
Beyond the raw log, a few free tools give you a friendlier view:
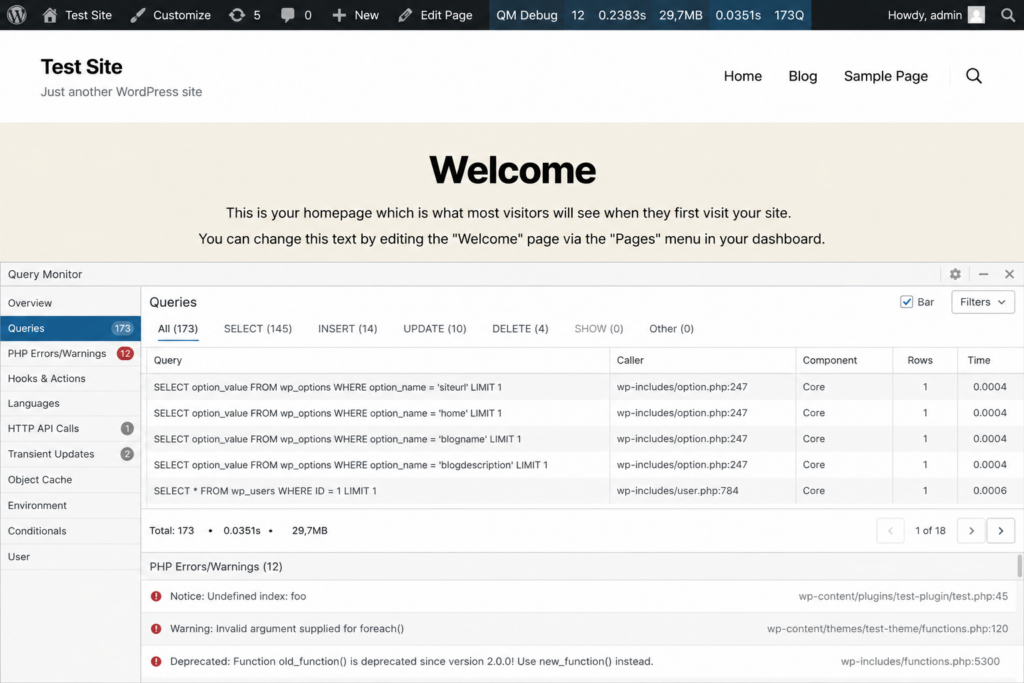
- Query Monitor — the most powerful free debugging plugin. It adds a panel showing database queries, PHP errors, hooks, HTTP requests, and more, all in the admin bar. Indispensable for performance and development work.
- Debug Bar — adds a debug menu to the admin bar with query, cache, and request info; tracks PHP warnings and notices when WP_DEBUG is on.
- Health Check & Troubleshooting — lets you disable plugins and themes for your session only, so you can isolate a conflict without taking the live site down for visitors.
Finding slow database queries with SAVEQUERIES
If your site is slow rather than broken, the SAVEQUERIES constant helps you find the culprit. When enabled in wp-config.php, WordPress records every database query — along with how long each took and what called it — in an array you can inspect:
define( 'SAVEQUERIES', true );With it on, you can print the query list (the $wpdb->queries array) in a template or with a snippet to see which queries are slow and which plugin triggered them. Because logging every query adds overhead, only enable SAVEQUERIES while investigating, and turn it off afterward. For most people, the Query Monitor plugin (below) presents this same data in a far friendlier way.
How to turn off debug mode
This step matters as much as turning it on. Leaving debug mode active on a live site is both a security risk (it can expose file paths and code) and a performance drain (the log file grows indefinitely and eats disk space). When you’re done troubleshooting:
- Set
WP_DEBUG,WP_DEBUG_LOG, andWP_DEBUG_DISPLAYback tofalse(or remove the lines) inwp-config.php— or deactivate the WP Debugging plugin if you used Method 2. - Delete the
debug.logfile fromwp-content, since it can contain sensitive information and may have grown large.
If the file never gets created, check a few things: WP_DEBUG must be true for WP_DEBUG_LOG to work; the wp-content folder needs to be writable (permission 755); and a server-level display_errors Off in php.ini or a must-use plugin can sometimes suppress output. Also remember the log only records errors that occur after you enable it.
Copahost gives you cPanel and FTP access to edit wp-config.php, error logs to diagnose issues, and support that helps when a plugin or theme breaks your site. Everything you need to find and fix errors fast.
See web hosting plansFrequently asked questions
What is WP_DEBUG in WordPress?
WP_DEBUG is a PHP constant in the wp-config.php file that turns on WordPress debug mode. When set to true, WordPress reports all PHP errors, warnings, and notices instead of hiding them, which helps you find what’s breaking your site. It’s false by default.
How do I enable debug mode in WordPress?
Edit wp-config.php and set define(‘WP_DEBUG’, true);. To log errors to a file without showing them to visitors, also add WP_DEBUG_LOG as true and WP_DEBUG_DISPLAY as false. Alternatively, use the free WP Debugging plugin, which enables it without editing files.
Where is the WordPress debug log stored?
In the file /wp-content/debug.log, once you’ve enabled WP_DEBUG_LOG. You can open it through your File Manager or FTP, or download it to read in a text editor. It only records errors that happen after you turn logging on.
Is it safe to leave WP_DEBUG on?
No. On a live site, debug mode can expose file paths and code to visitors (a security risk) and the log file grows indefinitely (wasting disk space). Enable it only while troubleshooting, then set the constants back to false and delete the debug.log file.
Why is my debug.log file not being created?
WP_DEBUG must be true for WP_DEBUG_LOG to work, and the wp-content folder must be writable. A server-level display_errors setting or a must-use plugin can also suppress it. Remember the log only captures errors that occur after enabling it, so reproduce the problem first.
Related guides
Debugging connects to several WordPress topics — see our guides on the wp-config.php file, the white screen of death, the critical error, and our hub of common WordPress errors.
Conclusion
WordPress debug mode is the fastest way to turn a mysterious white screen into a specific, fixable error. Enable WP_DEBUG (ideally with WP_DEBUG_LOG on and WP_DEBUG_DISPLAY off so visitors never see the errors), reproduce the problem, and read the log — the file path in a fatal error usually names the plugin or theme at fault. Tools like Query Monitor make the process even easier. Just remember the one rule that protects your site: debug mode is a temporary tool. Turn it off and delete the log the moment you’re done.
